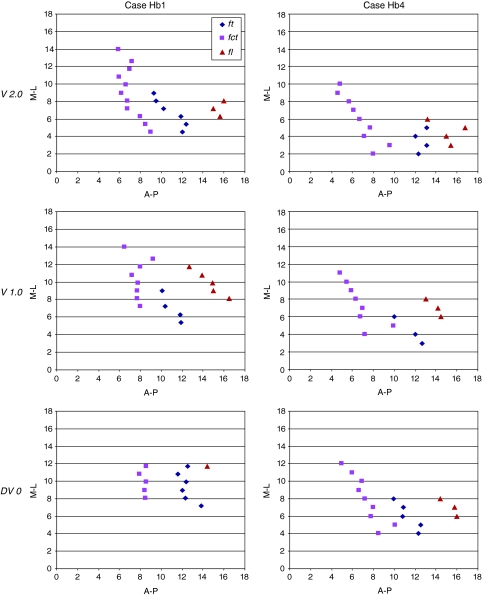
Fig. 13.
Spatial relationship between the fct, ft, and fl. In each diagram, the x-axis represents the distance (mm) to the posterior commissure and the y-axis, the distance to the medial thalamic border. The distances were measured at three different dorsoventral levels [2 mm ventral (V2) and 1 mm ventral (V1) to intercommissural level, and intercommissural level (DV0)] of two different brains (Hb1 and Hb4) cut in the sagittal plane. For each dorsoventral level, the center of the bulk on the anteroposterior (A-P) axis was measured at medio-lateral (M-L) levels between 0 (ventricular border) and 18 mm

