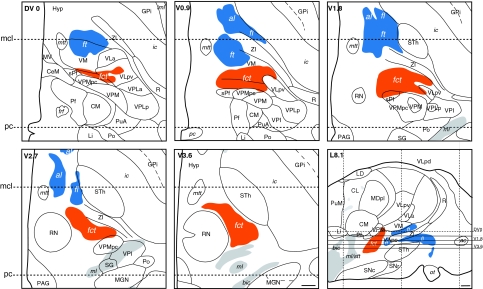
Fig. 6.
Pallidothalamic (blue) and cerebellothalamic (orange) tracts drawn on horizontal sections of the atlas at intercommissural level (DV0) and four levels ventral to DV0 (V0.9, V1.8, V2.7, and V3.6). The horizontal planes are projected on a sagittal section of the atlas 8.1 mm distant from the ventricular border (L8.1) in lower right panel. The pc and mcl levels are represented on the horizontal and sagittal maps by dotted lines. Scale bars (lower right panels): 2 mm

