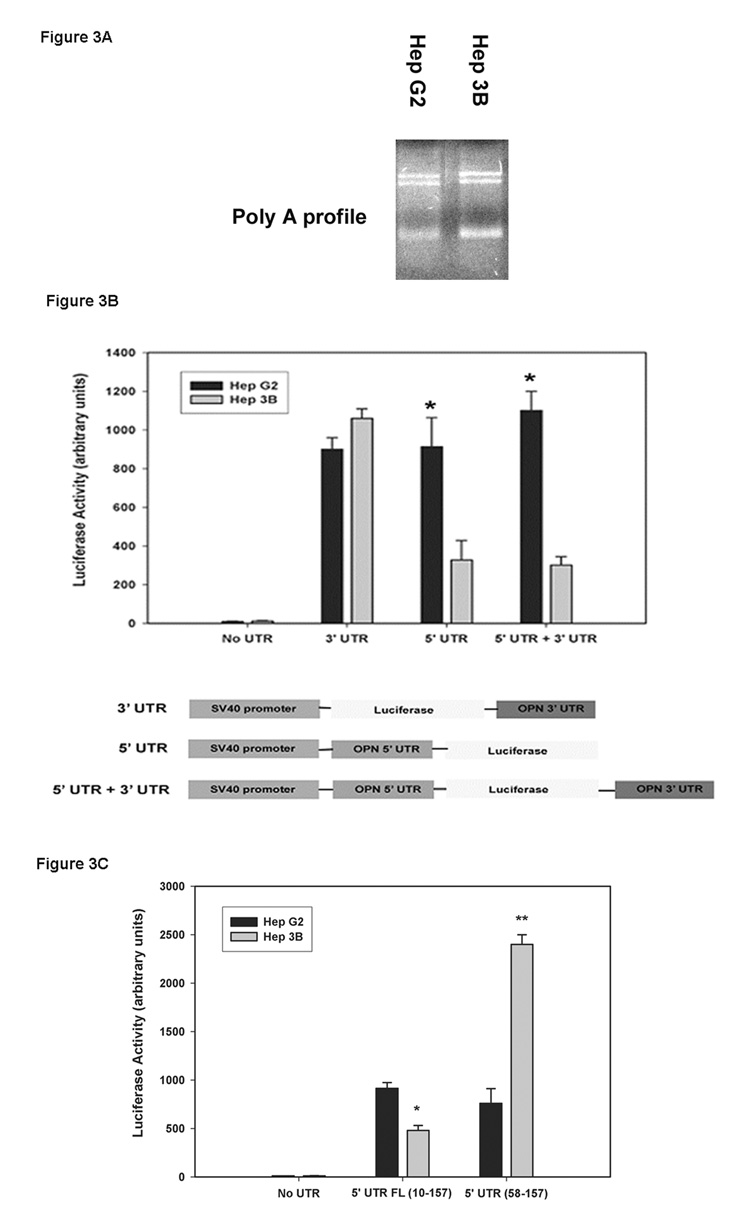
Figure 3. Assessment of post-transcription modifications in the OPN 5’-UTR and 3’-UTR in HepG2 and Hep3B cells.
(A) Poly (A) tail profile of HepG2 and Hep3B OPN mRNA was determined by using oligo (dT) linker and T4 ligase followed by RT-PCR. PCR products were resolved on 1.2% agarose gel and visualized using ethidium-bromide staining and detection.
(B) Schematic representation of OPN 3’-UTR and/or 5’-UTR cloned into luciferase containing PGL-3 plasmid vector with SV-40 promoter. Luciferase activity was determined in HepG2 and Hep3B cells transiently transfected with the above constructs (n=3). Data are expressed as mean ± SEM. (* p<0.05 vs. Hep3B).
(C) Luciferase activity was performed on the HCC cell lines transiently transfected with full-length 5’-UTR as shown in Figure 3B or deletion of nt 10–57 fragment in the 5’-UTR (58–157) construct (n=3). Data are expressed as mean +/− SEM. *p values <0.05 were considered significant.

