
Figure 4.
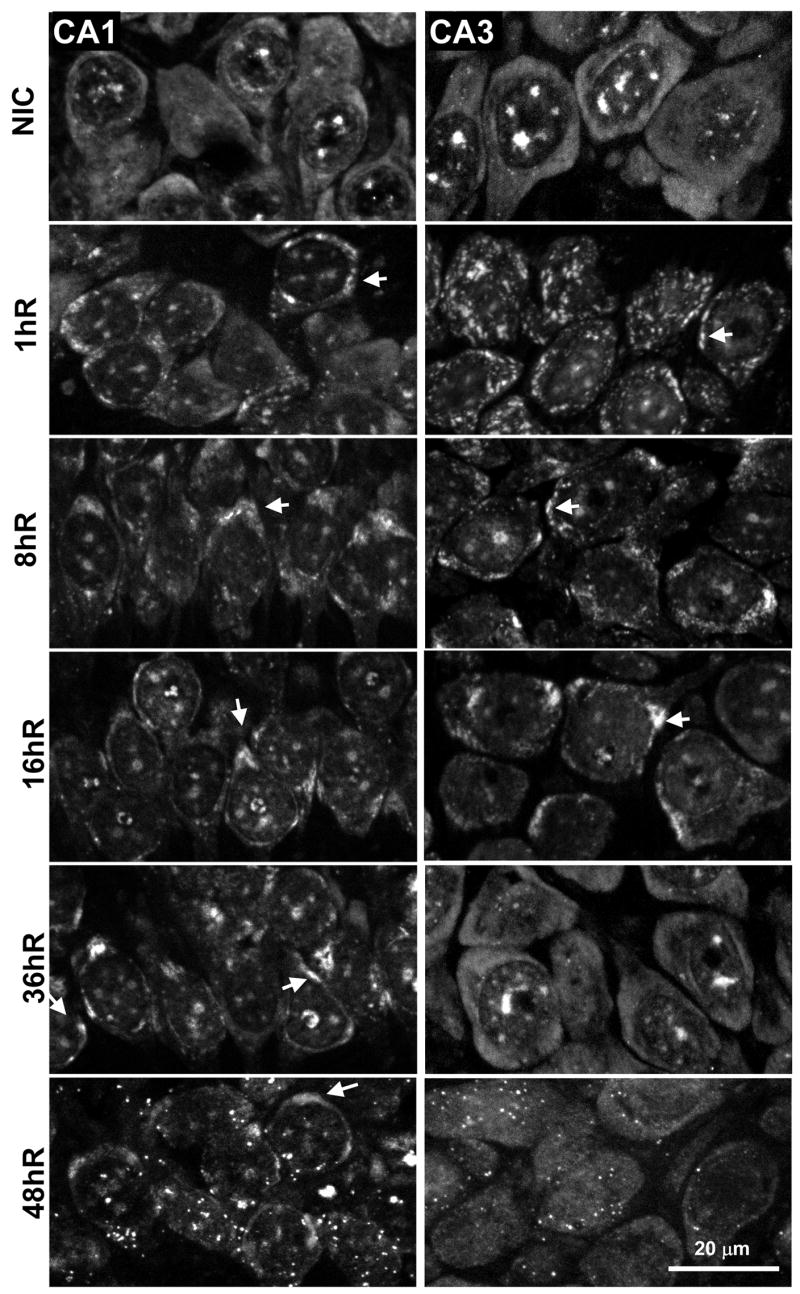
Staining for poly-adenylated [poly(A)]-containing mRNAs in nonischemic controls (NIC) and from 1 – 48 hr reperfusion (1hR-48hR, respectively). Fluorescent photomicrographs of CA1 (left column) and CA3 (right column) pyramidal layer of representative samples (n=5-6 per group) from experimental groups as indicated. Images are derived from orthographic projections of a 3.5 micron z-stack taken under 63X oil immersion. Arrows denote mRNA granules (see text). Scale bar is 20 microns and applies to all panels.