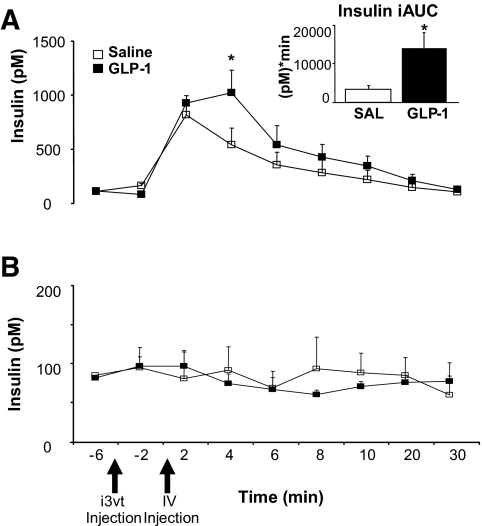
FIG. 2.
Insulin response to an intravenous glucose or saline bolus 5 min after i3vt GLP-1 or saline injection. A: Insulin levels were significantly greater at 4 min, and area under the curve for insulin response was significantly greater after GLP-1 (inset). B: Insulin levels did not significantly change with an intravenous saline bolus after i3vt GLP-1 and saline injections. *P < 0.05 vs. saline.

