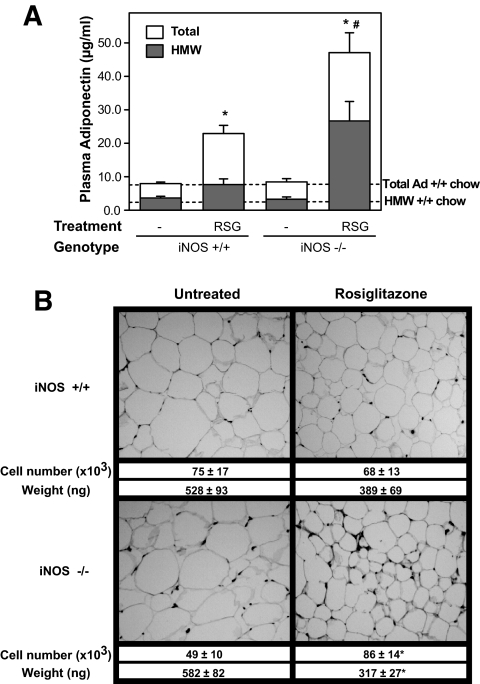
FIG. 4.
Effect of iNOS gene disruption and rosiglitazone treatment on plasma adiponectin and adipose tissue remodeling in high-fat–fed obese mice. A: Total adiponectin concentrations (□) and high–molecular weight adiponectin complexes (HMW, ▪) were measured in plasma by radioimmunoassay and size fractionation followed by quantitative Western blotting, respectively. The dotted lines corresponds to total and high–molecular weight adiponectin levels in untreated chow-fed iNOS+/+ mice. B: Histological analysis of WAT of high-fat–fed animals. Mean weight and cell number per fat pad are also shown. Bars represent the means ± SE of 5–16 mice per group. *P < 0.05 vs. untreated mice, #P < 0.05 vs. iNOS+/+ mice.

