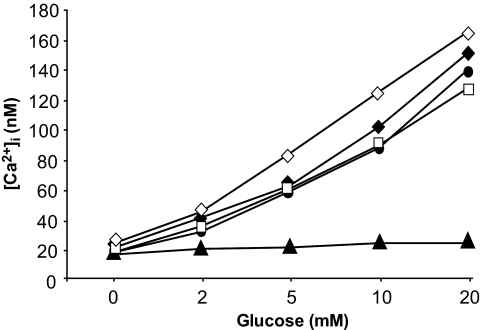
FIG. 7.
Mean change in [Ca2+]i in response to 2, 5, 10, and 20 mmol/l glucose for mock-transfected (unfilled diamond) INS1 cells or INS1 cells transfected with nonsense (unfilled square), Sox4(1) (filled diamond), Sox4(2) (filled circle), or Gck (filled triangle) siRNA. Each data point is the mean of 14–24 cells. The data are representative of two separate experiments.

