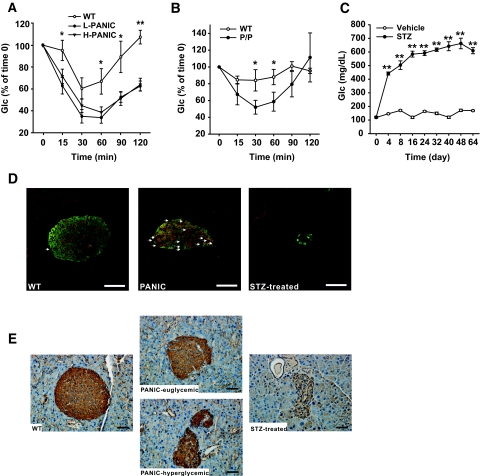
FIG. 6.
PANIC-ATTAC mice display improved insulin sensitivity and increased population of GLUT2+/insulin− cells after recovery. A: ITT on hemizygous PANIC-ATTAC mice after recovery. Significant differences are seen between wild type vs. low responders (L-PANIC) and wild-type vs. high responders (H-PANIC) at 15, 60, 90, and 120 min. There is no difference between L-PANIC and H-PANIC during the entire course. Wild type, n = 3; L-PANIC, n = 3; H-PANIC, n = 6. *P < 0.05, **P < 0.001. B: ITT on homozygous PANIC-ATTAC mice (P/P) after recovery. Significant differences are found between wild-type (n = 4) and P/P (n = 3) mice at 30 and 60 min. *P < 0.05. C: Glucose profile of animals administered vehicle and STZ. Vehicle, n = 4; STZ, n = 5. **P < 0.001. D: Immunofluorescent staining of insulin (green), GLUT2 (red), and nuclei (blue) in recovered homozygous PANIC-ATTAC mice. Arrows indicate GLUT2+/insulin− cells. Note that there are more GLUT2+/insulin− cells present in recovered PANIC-ATTAC animals compared with wild-type control mice. In the group administered STZ, very few insulin+ cells are left, and the islet architecture is disrupted. Scale bar = 50 μm. E: Immunohistochemistry staining for GLUT2 in wild-type and homozygous PANIC-ATTAC mice and mice with STZ-induced diabetes. Note that the membrane-bound GLUT2 is restored in the PANIC-euglycemic group, whereas hyperglycemic PANIC-ATTAC mice show intracellular localization of GLUT2 despite the relative normalization of the total signal. Scale bar = 50 μm. (Please see http://dx.doi.org/10.2337/db07-1631 for a high-quality digital representation of this figure.)

