
Fig. 1.
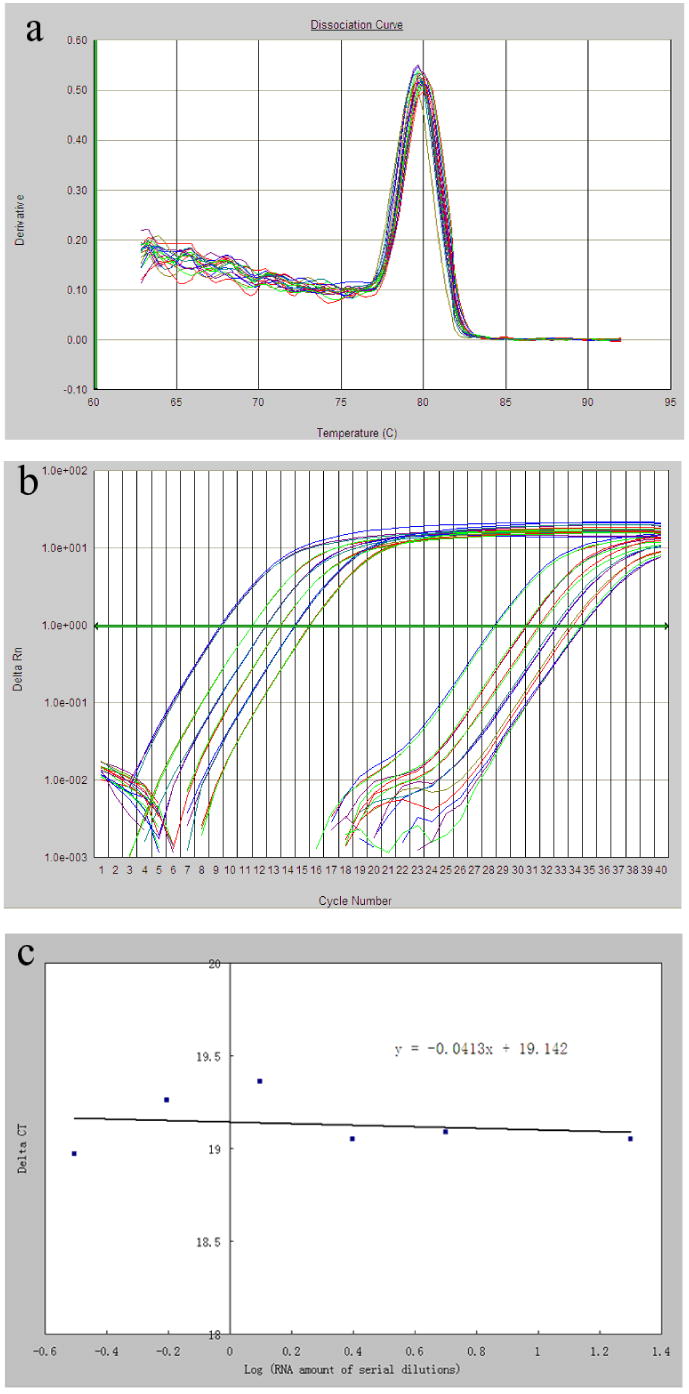
Primer validation for quantitative real time RT-PCR using the comparative CT method. a) A representative dissociation curve with a single peak, indicating the specificity of the amplification for the target gene (G6PD). b) A representative amplification plot of real time RT-PCR for the endogenous control, 18S rRNA, and the target gene (G6PD). The two sets of six curves for each gene (left set for 18S rRNA, right set for G6PD) represent serial cDNA dilutions of 20, 5, 2.5, 1.25, 0.625, 0.3125 ng (from left to right), respectively. The horizontal line in the middle was the threshold established for the calculation of the CT value. c) A representative linear regression between ΔCT, i.e. CT(18S rRNA)- CT(target gene) and the log value of cDNA amount. The absolute value of the slope (0.0413) was smaller than 0.1, demonstrating equal amplification efficiencies between the 18s rRNA (endogenous control) and the target gene (G6PD) within the cDNA dilutions tested.