
Fig. 7.
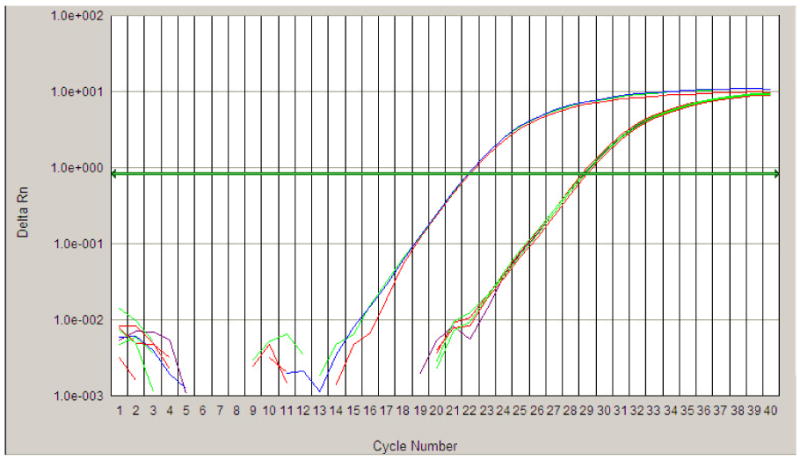
A quantitative real time amplification plot for the determination of the TSIX transcripts. The series of curves on the left represent triplicate amplifications of XIST using the XIST-specific primer. The series of curves on the right represent triplicate amplifications TSIX using either the TSIX-specific primer or no primers. The amplification curves for TSIX with and without primers overlapped, indicating a lack of TSIX transcripts in the samples. The same amount of total RNA was used in all amplifications in this figure.