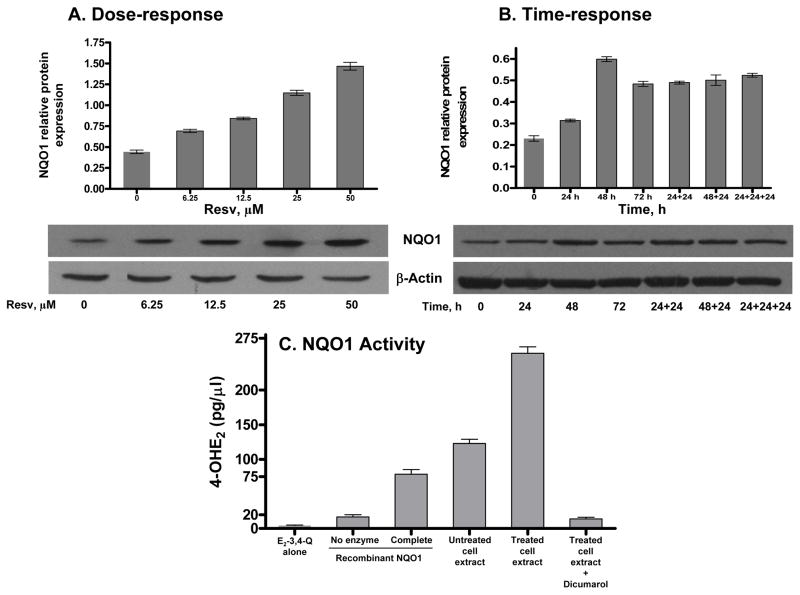
Figure 3.
Induction of NQO1 expression and activity by Resv. Each lane contains 25 μg of cell lysate. Intensity of the bands was quantified and normalized as described in Methods and Materials (n=3). (A) NQO1 expression in MCF-10F cells treated with increasing concentrations of Resv for 48 h. (B) Cells were treated with one 25 μM dose of Resv for various times (24–72 h) or with multiple 25 μM doses of Resv for the indicated time periods. (C) Cellular NQO1 (25 μg) enzymatic activity was determined by UPLC-MS/MS. The levels of the reaction product, 4-OHE2, in treated cells were significantly different from those in the untreated cells, p< 0.05 as determined by ANOVA.

