
Fig. 1.
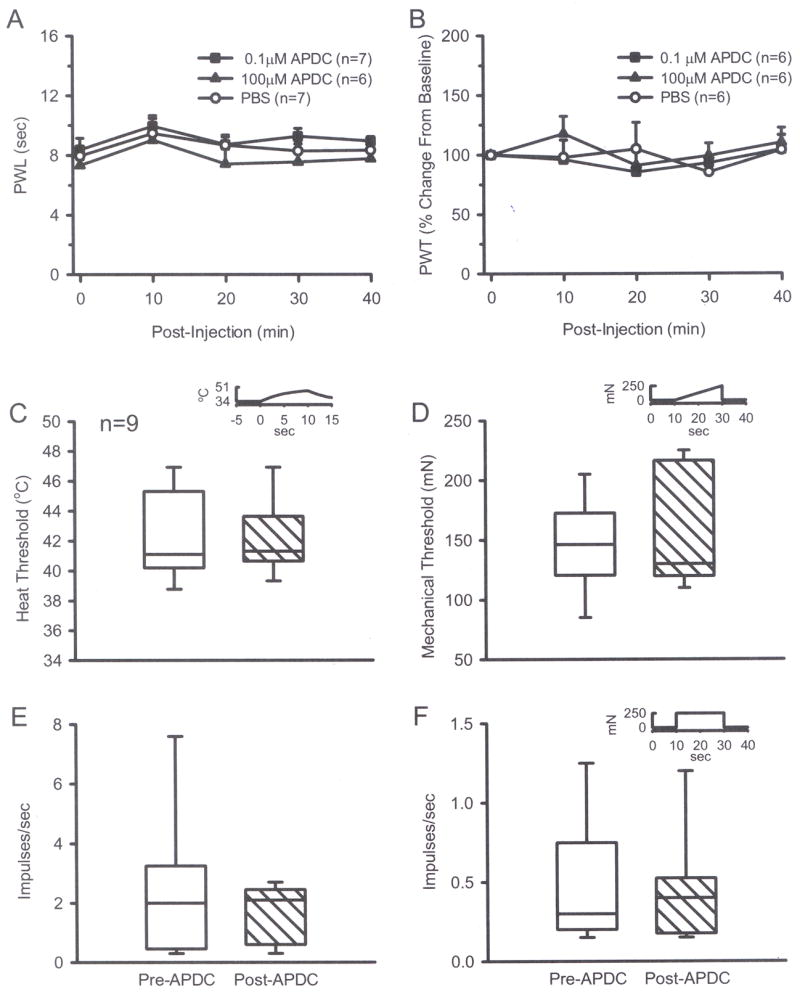
Intraplantar injection of 0.1 μM or 100 μM APDC alone did not change thermal (A) or mechanical (B) thresholds compared to PBS groups (one-way ANOVA). A 2 min exposure of CMH fibers in normal skin to 0.5 μM APDC had no effect on thermal threshold (C) or discharge rate (E). There was no effect on mechanical threshold (D) or on discharge rate (F) in response to a suprathreshold mechanical stimulus (Wilcoxon test). Insets in C, D, and F show stimulus parameters. Median evoked responses are plotted in C–F. Box plot values: the thick horizontal line within each box is the median value, the upper and lower edges of each box represent the 75th and 25th percentiles, respectively; the upper and lower whiskers represent the 90th and 10th percentiles, respectively.