
Fig. 7.
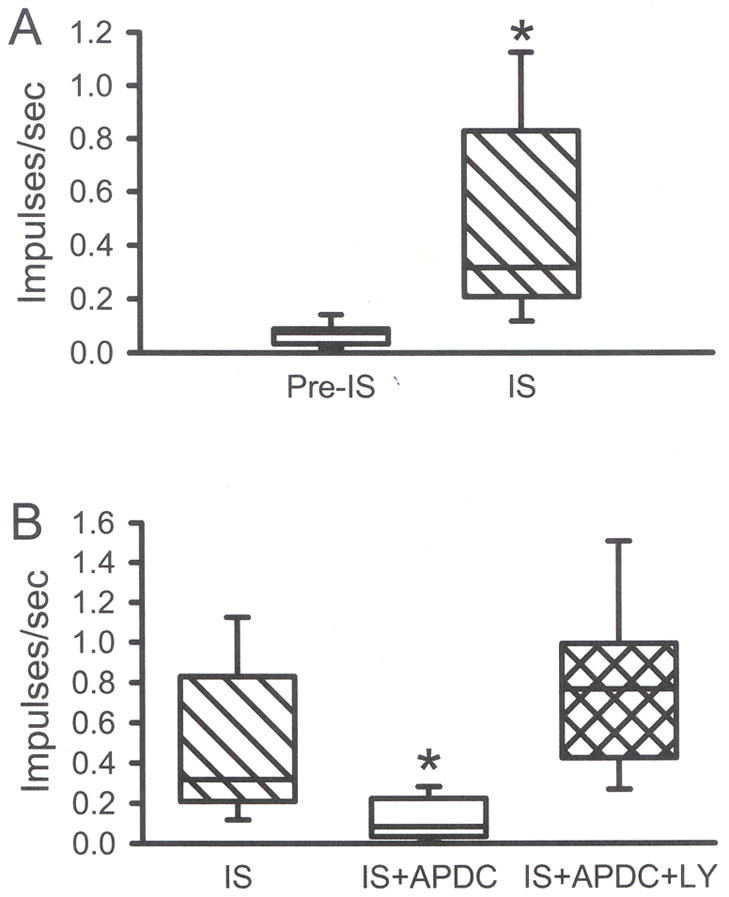
A) Compared to pre-IS baseline, IS induced a robust increase in the discharge rate of CMH fibers (*p<0.05, Wilcoxon test,). B) Co-application of 0.5 μM APDC + IS blocked this increase and 100 μM LY (IS+APDC+LY) blocked the APDC-induced inhibition (B, p<0.05, *significantly different from all other groups, Kruskal-Wallis test). Median evoked responses are plotted. Box plot values same as in Fig. 1.