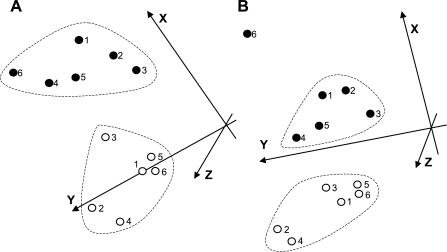
Fig. 4.
Segregation of animals with cardiac dysfunction from animals with compensatory hypertrophy using selected genes. A: the 22 genes from Table 4 were used for PCA to provide more visual analysis of clustering of individual animals with similar changes (see methods for more details). Further analysis using genes with expression that changed twofold or greater (Table 4, asterisk) is provided in B. Individual animals are identified by numbers, as in Fig. 1.

