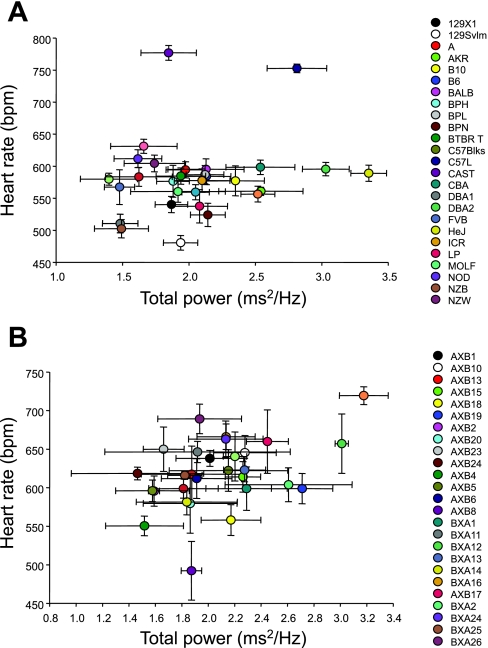
Fig. 3.
A: cosegregation plot of HR and TP HRV from 30 inbred strains of mice. No correlation between these variables was found (R = 0.18). Values are means ± SE from 20 min of ECG recording. B: cosegregation plot of HR and TP HRV from 29 AXB/BXA RI strains of mice. No correlation between these variables was found (R = 0.42). Values are means ± SE from 20 min of ECG recording.

