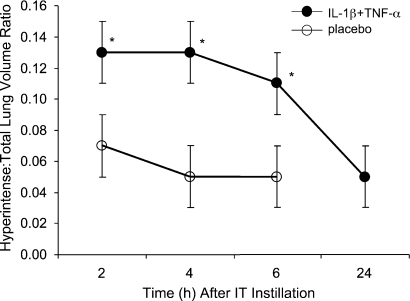
Fig. 2.
Time course of HTLV ratio for IL-1β+TNF-α- and placebo-treated mice. MRI was performed at 2, 4, and 6 h in the same mice. At these time points, the mean HTLV volume ratio was greater for IL-1β+TNF-α-treated mice than placebo-treated mice [*P = 0.04 (2 h), P = 0.001 (4 h), P = 0.03 (6 h)]. By 24 h, the mean (±SE) HTLV ratio of IL-1β+TNF-α-treated mice returned to control values (0.05 ± 0.00 and 0.07 ± 0.02, respectively; P = 0.52). Data are means (±SE) for 4 animals/group.

