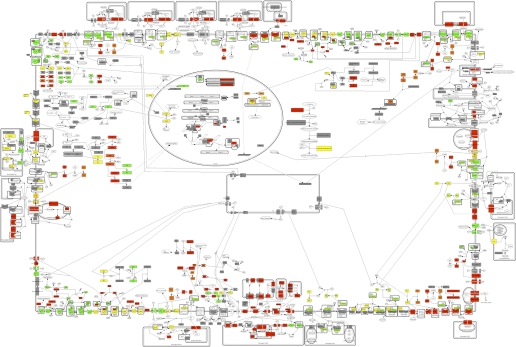
Fig. 2.
Pathway analysis of signaling networks relevant to nucleus tractus solitarius (NTS) control of baroreflex in response to acute hypertension. An in silico prototypical neuron model was constructed from 27 curated signaling pathways that have been implicated in the baroreflex response of NTS neurons. Figure depicts the physiological transcriptional response 60 min after the onset of hypertension. Proteins corresponding to regulated genes are colored red (upregulated) and green (downregulated). Proteins corresponding to both upregulated and downregulated genes are colored with a weighted mixture of red and green. Pathway components whose genes were not significantly regulated are colored gray. Unmeasured pathway components are not colored. The enlarged versions of the in silico model, colored based on transcriptional response at each of the five time points, are available (see Supplemental Figs. S1 through S5).

