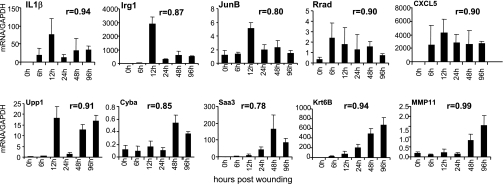
Fig. 6.
Real-time PCR validation of GeneChip microarray expression analysis. Expression levels of selected genes identified (Tables S2–S6) using GeneChip analysis were independently determined using real-time PCR. The correlation coefficient (r) of data obtained from microarray analysis vs. real-time PCR is shown for each of the gene. The regression is derived from 4 pairs of data at each time point for a total number of 24. PCR data represent means ± SD, n = 5. The animals used for real-time PCR were a set that was independent of the animals used for microarray analysis. Irg-1, immunoresponsive gene 1; IL-1β, interleukin 1 beta; JunB, Jun-B oncogene; Rrad, Ras-related associated with diabetes; CXCL5, chemokine (C-X-C motif) ligand 5; Upp1, uridine phosphorylase 1; Cyba, cytochrome b-245, alpha polypeptide (p22 phox); Saa3, serum amyloid A 3; Krtb6, keratin 6B; MMP11, matrix metallopeptidase 11.

