
Figure 3.
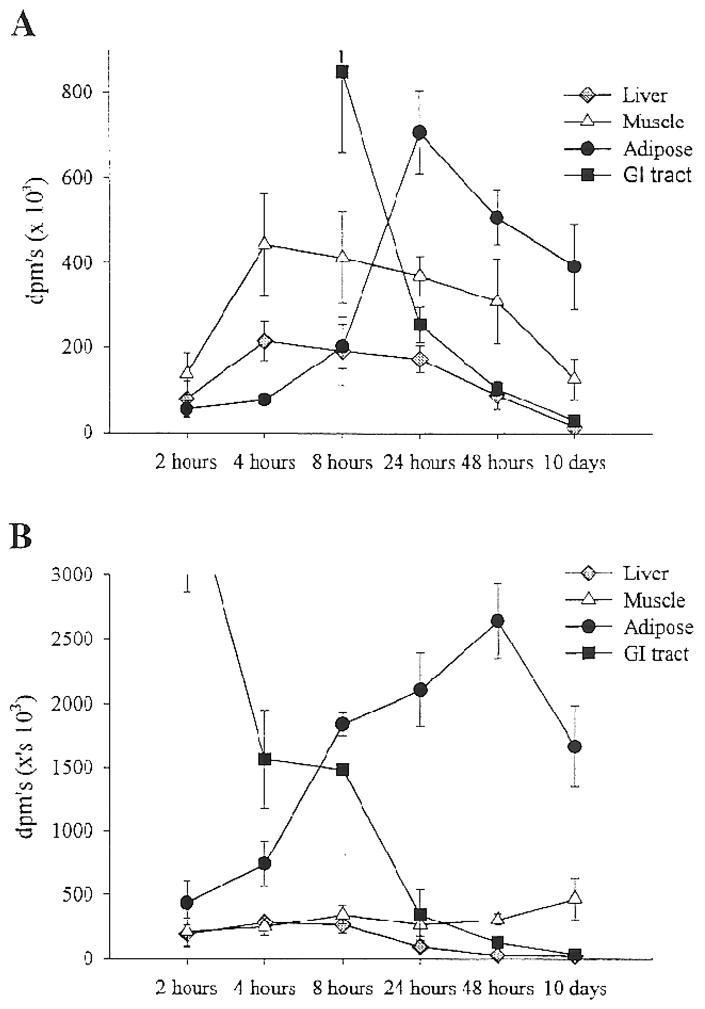
The tissue distribution of a dietary oleate tracer in the 10 days following the administration of a test meal in either the fasted (panel A) or previously fed (panel B) states (previously published in ref. 6).
Official websites use .gov
A
.gov website belongs to an official
government organization in the United States.
Secure .gov websites use HTTPS
A lock (
) or https:// means you've safely
connected to the .gov website. Share sensitive
information only on official, secure websites.
The tissue distribution of a dietary oleate tracer in the 10 days following the administration of a test meal in either the fasted (panel A) or previously fed (panel B) states (previously published in ref. 6).