
Figure 7.
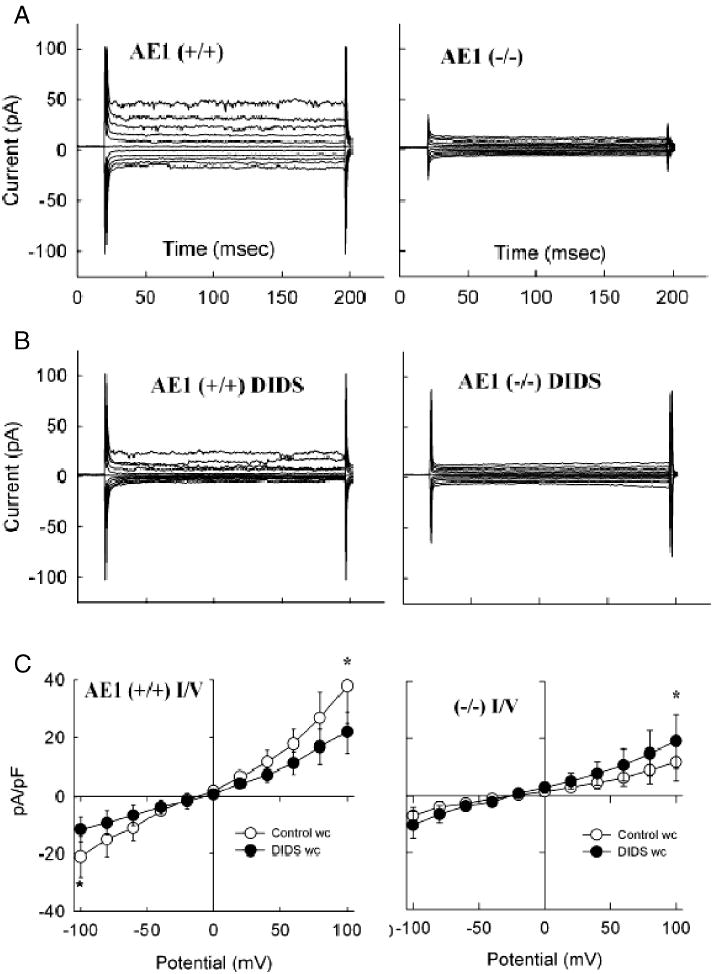
Whole cell Cl- currents recorded in the nystatin-permeabilized patch clamp configuration from Ae1+/+ (left) and from Ae1-/- mouse red cells (right). Representative family of current traces recorded during voltage steps in the absence (A) or presence of 10 μM DIDS (B). C. Mean I-V curves recorded from Ae1+/+ (n=8) and Ae1-/- red cells (n=9) in the absence (open circles) and presence of 10 μM DIDS (closed circles). Currents are capacitance-normalized.