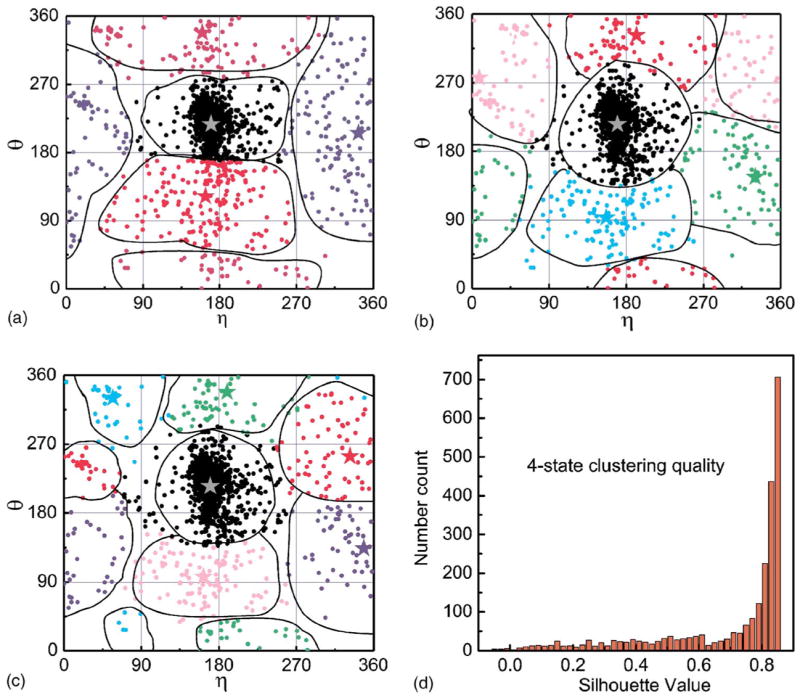
FIG. 3.

(Color online) The set of (θ,η) angle pairs of clusters in RNA molecules and the centers of k-clusters calculated by the k-mean clustering method. The centers are marked by stars. (a), (b), and (c) are for k=4, 5, and 6 clusters, respectively. (d) shows the distribution of Silhouette value calculated for the 4-state clustering procedure.
