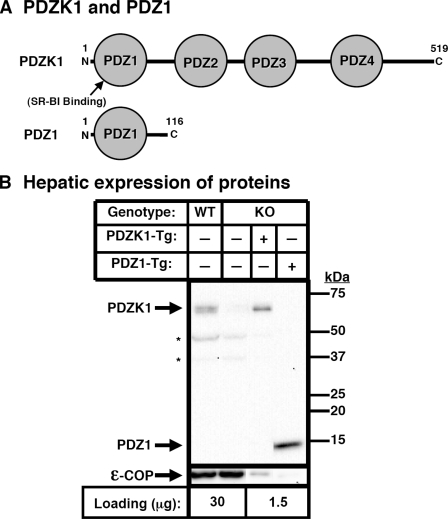
FIGURE 1.
Hepatic expression of PDZK1 and PDZ1 transgenes. A, schematic diagrams of the proteins encoded by the PDZK1 (top) and PDZ1 (bottom) transgenes. B, immunoblot analysis of hepatic expression of PDZK1 and PDZ1 proteins in PDZK1 and PDZ1 transgenic mice. Hepatic protein levels are shown in nontransgenic WT and PDZK1 KO mice (left two lanes) and PDKZI KO[PDZK1-Tg] and PDZK1 KO[PDZ1-Tg] mice (right two lanes). Liver lysates from mice with the indicated genotypes and transgenes (30 or 1.5 μg of protein/lane) were analyzed by immunoblotting, and the bands corresponding to either PDZK1 (∼60 kDa) or PDZ1 (∼14 kDa) were visualized by chemiluminescence. Size markers are indicated on the right. ε-COP (∼34 kDa band, bottom) was used as a loading control. Replicate experiments with multiple exposures and sample loading were used to determine the relative levels of expression of these proteins. Note the faint ε-COP band visible in the last lane. Samples shown were all from a single gel but reordered for presentation purposes. *, background bands seen in all samples.

