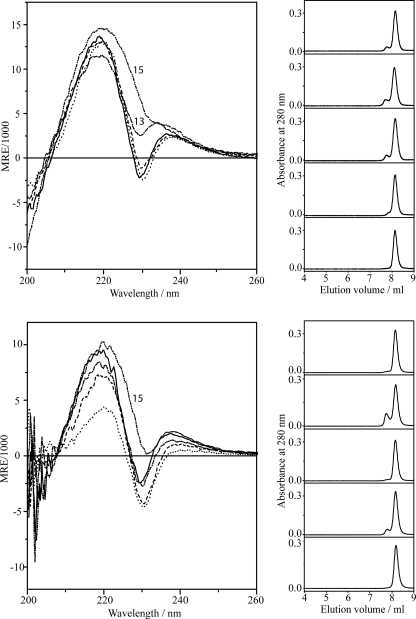
FIGURE 2.
CD spectra and SEC elution profiles for singly substituted 1-Me-Trp analogues in DMPC vesicles (top) and in DOPC vesicles (bottom). The SEC elution profiles were normalized for comparison. From top to bottom, gA (------), 1-MeTrp9 (···), 1-Me-Trp11 (-- -- --), 1-Me-Trp13 (--·--·--; labeled 13), 1-Me- Trp15 (--··--··--; labeled 15).

