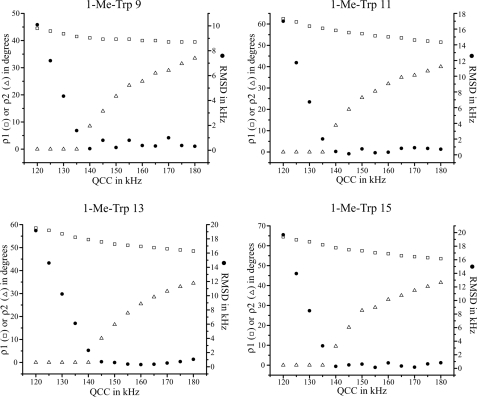
FIGURE 6.
Graphs to show the variation of the best fit ρ1 and ρ2, and the minimum value of root mean square deviation, as functions of apparent QCC [(static QCC) × Szz] for 1-Me-Trp indole ring at positions 9, 11, 13, and 15, respectively. See also Ref. 44.

