FIGURE 2.
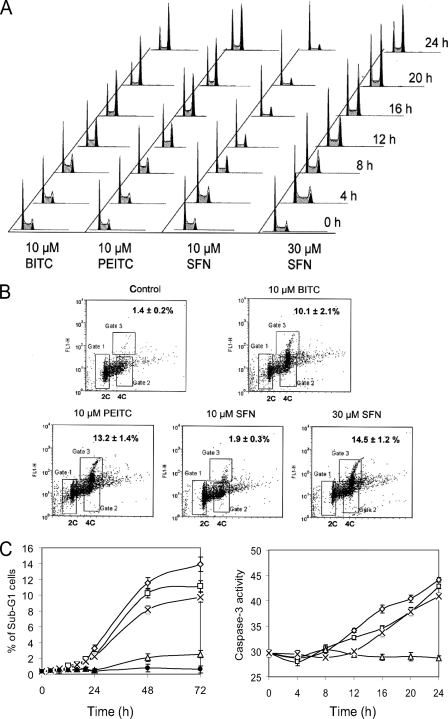
BITC, PEITC, and SFN induce cell cycle arrest and apoptosis in A549 cells. A, histograms of ITC-treated cells indicating that 10 μm BITC, 10 μm PEITC, and 30 μm SFN induce substantial G2/M arrest (increase of the second peak), whereas 10 μm SFN induce G1 arrest. B, substantial amounts of mitotic cells were detected after treatments with 10 μm BITC, 10 μm PEITC, and 30 μm SFN for 24 h but not in cells treated with 10 μm SFN. The mitotic cells are identified as having a tetraploid DNA content and a high level of phosphorylated histone 3 as indicated in Gate 3. Gate 1 contains cells with diploid DNA, whereas Gate 2 contains cells with tetraploid DNA and low level of phospho-H3. Numbers in the upper right corners indicate percentages of mitotic cells in each sample. C, induction of apoptosis was indicated by increases in the relative size of sub-G1 fractions of cells (left) and increased caspases-3 activities (right) in cells treated with 10 μm BITC (⋄), 10 μm PEITC (□), and 30 μm SFN (×) but not in 10 μm SFN (▵) and DMSO (•).

