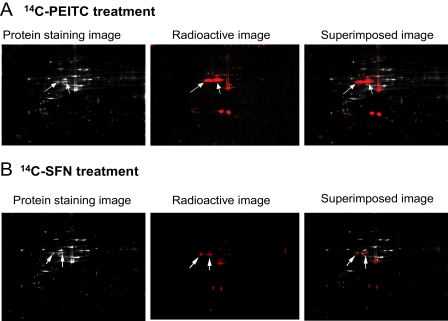
FIGURE 3.
Two-dimensional gel electrophoresis images of A549 whole cell lysates after treatments with 20 μm14C-PEITC (A) and 14C-SFN (B) for 1 h. The colloidal Coomassie Blue staining images show the total protein profiles; the radioactive images obtained by exposing dried two-dimensional gel to x-ray film show the profiles of the 14C-ITC bound proteins; the superimposed images were used for identifying individual protein of ITCs in two-dimensional gel. The two arrows point to the spots containing α- and β-tubulin.

