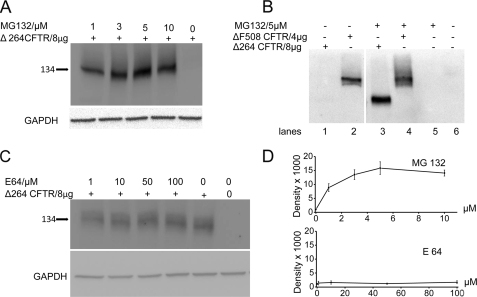
FIGURE 2.
A, proteasome inhibition is shown. Cells were transfected with Δ264 cDNA and treated with MG132. Δ264 CFTR protein expression is not detectable in the absence but is increased dramatically in the presence of proteasome inhibitors (upper panel)(n = 4). B, cells were transfected with Δ264 or ΔF508 CFTR and treated with MG132. Δ264 CFTR protein expression is not detectable in the absence of MG132 (lane 1) but is increased dramatically by proteasome inhibition (lane 3). Note that ΔF508-CFTR is detectable in the absence of MG132 (lane 2) and increases modestly in the presence of MG132 (lane 4); lanes 5 and 6 are negative controls (n = 7). The two panels are from the same gel. C, COS7 cells were transfected with Δ264 CFTR and treated with lysosome inhibitor (E64) for 16 h. There is very little change in band density among all the treatment groups and Δ264 CFTR in the absence of the inhibitor. D, summary data for proteasomal and lysosomal inhibition experiments is shown. Only MG132 significantly increases Δ264 CFTR protein expression.

