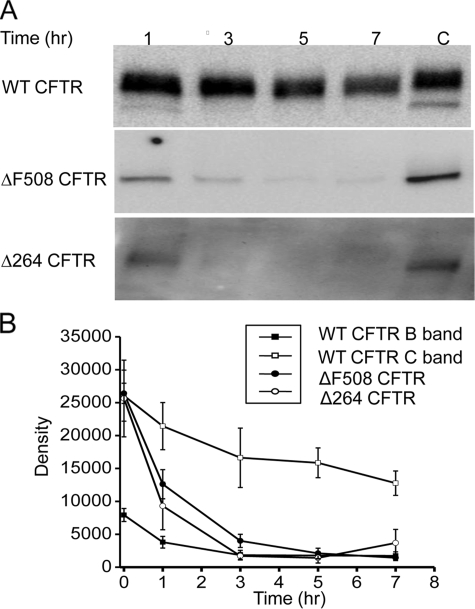
FIGURE 3.
A, degradation assayed by inhibition of protein synthesis. COS7 cells were transfected with either WT, ΔF508, or Δ264 CFTR and treated with cycloheximide (25 μg/ml) for the indicated times (n = 4 for WT CFTR and ΔF508 CFTR, n = 3 for Δ264 CFTR). In this experiment, exposure times for the Fuji density measurements were 3 s for WT CFTR, 40 s for ΔF508 CFTR, and 5 min for Δ264 CFTR. This gave approximately equal density values at time 0 for the graph in B. Please note that the exposure times were varied in this experiment so that we could accurately measure the change in density following exposure to cycloheximide treatment for the various times especially for Δ264 CFTR. C indicates control. B, summary data of cycloheximide experiments. The differences in the rate of decay between Δ264 CFTR and ΔF508 CFTR are significantly different using the mean at time point 0–5, p < 0.05.

