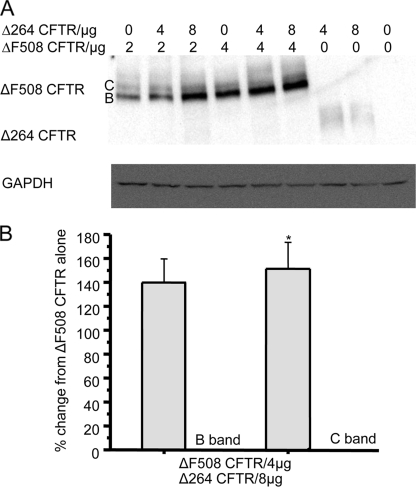
FIGURE 8.
A, COS7 cells were transfected either with Δ264 CFTR or ΔF508 CFTR alone or with both plasmids in combination. Δ264 CFTR increases expression of mature band C and immature band B of ΔF508 CFTR. Legend at the top represents micrograms of cDNA of each construct that was transfected. B, summary data is shown. Both C and B band densities were measured. Data are significantly different only for an increase in C band. The control (no Δ264 CFTR transfected) is normalized to 100% compared with the % increase with Δ264 CFTR. *, data are significantly different for the increase in C band only.

