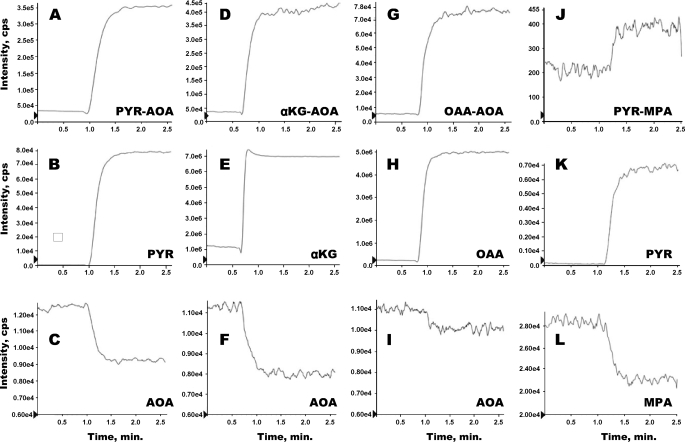
FIGURE 7.
In vitro formation of adducts between (i) AOA and either pyruvate (PYR), α-ketoglutarate (αKG), or OAA (A–I), and (ii) MPA and pyruvate (J–L). Each vertical set of panels corresponds to the reaction of one ketoacid with either AOA or MPA. For example, a solution of 0.5 mm AOA (pH 7.4; T = 37 °C) was infused in the source of the mass spectrometer. After 1 min, 0.2 mm pyruvate was added to the AOA solution. The signals of AOA, pyruvate, and the pyruvate-AOA adduct are shown in C, B, and A, respectively.

