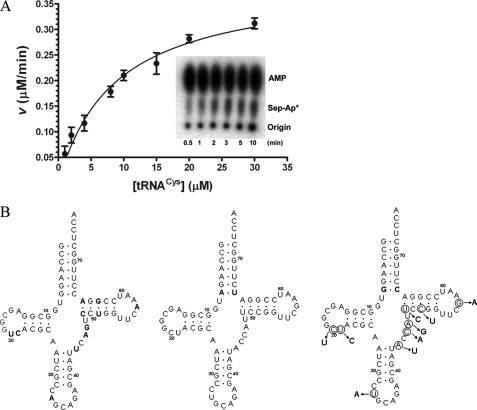
FIGURE 1.
A, dependence of reaction rate on tRNA concentration for
aminoacylation by M. mazei SepRS. Replot of
 concentration
versus initial velocities determined from time courses. The
inset shows the imaged TLC plate of a single time course for
 . B, the
secondary structures of M. mazei tRNACys isoacceptors
 ,
,
 , and
, and
 , are depicted from
left to right. The 7-66 base pair at the bottom of the
acceptor stem, which distinguishes
 from
from
 , is shown in
boldface type on the
 cloverleaf at the
center. Nucleotides distinguishing
 (left) from
both
  and
and
 are shown in
boldface type on the
 cloverleaf. Mutations
of
  (right)
made in this study are circled. The correspondence between the
nucleotides and the mutations described under “Results and
Discussion” and in Table
1 is as follows: tRNACysΔ2, introduction of A33
from
  into
into
 ;
tRNACysΔ3, introduction of A57 from
 into
into
 ;
tRNACysΔ5, introduction of both C49 and U51 from
 into
into
 ;
tRNACysΔ4, introduction of the five D-loop and variable loop
nucleotides U20, C21, U44, A46, and G47 from
 into
into
 .
.

