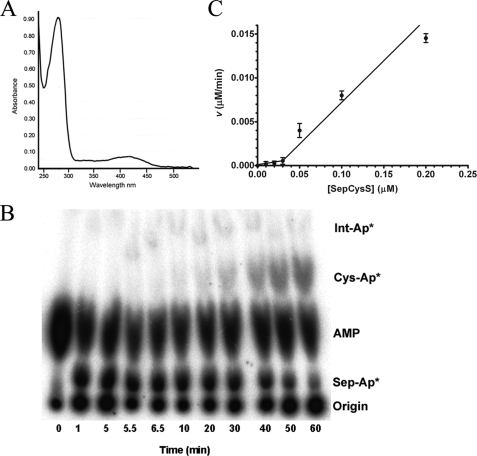
FIGURE 3.
A, UV-visible absorbance spectrum of SepCysS revealing the
presence of bound PLP in the overexpressed recombinant enzyme. B,
imaged TLC plate showing time-dependent formation of Cys-tRNACys
catalyzed by SepCysS. Conditions were as follows: 50 mm Tris (pH
7.5), 20 mm KCl, 10 mm MgCl2, 5 mm
ATP, 3 mm phosphoserine, 5 mm DTT, 10 μm
tRNACys, and 20 μm SepRS. After 5 min,
Cys-tRNACys formation was initiated by the addition of SepCysS to
20 μm and sodium sulfide to 5 mm. The percentage
conversion to Cys-tRNACys is determined by the ratio of the
intensities for Sep-AMP and Cys-AMP and converted to molarity by multiplying
by the concentration of Sep-tRNACys determined from the plateau
aminoacylation value. C, plot of the velocity of
Cys-tRNACys synthesis catalyzed by SepCysS versus enzyme
concentration under steady-state conditions. No activity is observed at enzyme
concentrations below 50 nm. A constant
 concentration of 5
μm was used.

