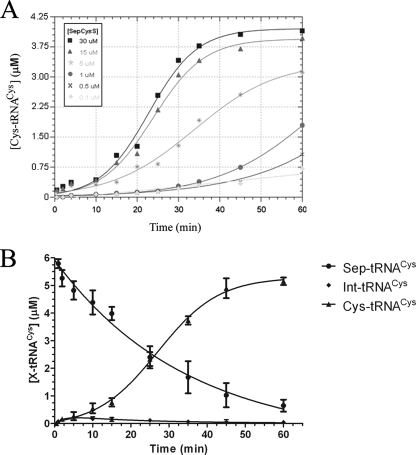
FIGURE 4.
A, time courses of Cys-tRNACys synthesis. Sigmoidal behavior is observed under conditions of enzyme excess. The conditions used were 0.10–30 μm SepRS as indicated by the different symbols, 5 mm sodium sulfide, and 5 μm Sep-tRNACys. Error bars are omitted for clarity but are similar to those depicted in Fig. 3C. B, plot of the decrease in Sep-tRNACys concentration together with Cys-tRNACys formation. Quantitation of spots on the imaged TLC plate resulting in concentration of each species present was plotted against time. The conditions were as follows: 50 mm Tris (pH 7.5), 20 mm KCl, 10 mm MgCl2, 5 mm ATP, 3 mm phosphoserine, 5 mm DTT, 6 μm Sep-tRNACys, and 20 μm SepCysS. A small amount of an intermediate species is observed that forms quickly and then disappears as Cys-tRNACys formation increases.

