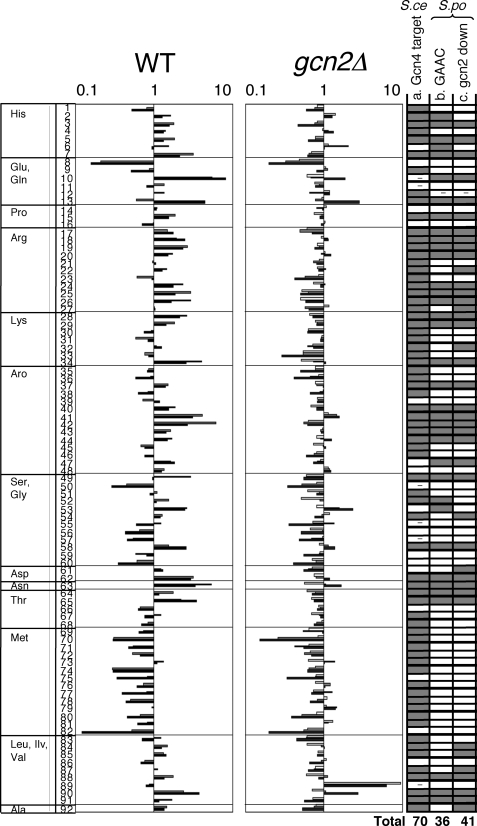
FIGURE 3.
The induction of amino acid synthesis genes is largely dependent on Gcn2. Relative mRNA levels from amino acid biosynthetic genes in wild-type and gcn2 mutant were taken from microarray data in this study. Levels are shown by logarithmic scale with the time course of 0 (white bar), 1 (gray bar), and 3 h (black bar) after 3AT treatment. The amino acid biosynthetic genes in S. cerevisiae were defined in (32). Amino acid enzymes were identified by homology using YOGY (48) and listed in the figure as follows: row 1, his1; 2, his5; 3, his2; 4, his7; 5, his3; 6, his6; 7, his4; 8, gln1; 9, PB1E7.07; 10, C132.04c; 11, C662.12c; 12, gst1; 13, gst2; 14, C17H9.13c; 15, pro1; 16, PYUG7.05; 17, C428.05c; 18, C725.14; 19, arg3; 20, argx; 21, arg7; 22, arg11; 23, C1271.14; 24, arg1; 25, arg5; 26, arg4; 27, map1; 28, lys3; 29, lys1; 30, lys2; 31, lys7; 32, C3B8.03; 33, C31G5.04; 34, lys4; 35, aro1; 36, C1223.14; 37, P8A3.07c; 38, C24H6.10c; 39, C16E8.04c; 40, C569.07; 41, C1773.13; 42, C56E4.03; 43, trp3; 44, trp1; 45, trp4; 46, trp2; 47, C30D10.16; 48, C1494.04c; 49, C364.97; 50, C3H7.07c; 51, gly1; 52, cit1; 53, C24C9.06c; 54, C1683.11c; 55, gcv1; 56, C13G6.06c; 57, P19A11.01; 58, dld1; 59, shm2; 60, C24C9.12c; 61, C725.01; 62, C10F6.13c; 63, C119.10; 64, C1827.06c; 65, C19F5.04; 66, C776.03; 67, C4C3.03; 68, thrc; 69, C3H7.02; 70, C869.05c; 71, C1739.06c; 72, C106.17c; 73, met6; 74, sua1; 75, met26; 76, C584.01c; 77, met5; 78, met14; 79, met16; 80, C428.11; 81, tol1; 82, sam1; 83, C1677.03c; 84, ilv1; 85, ilv3; 86, ilv5; 87, C14C8.04; 88, leu2; 89, leu1; 90, leu3; 91, eca39; 92, C582.08. In column a, the genes whose orthologs in S. cerevisiae are defined as Gcn4 targets are shown in gray. - indicates the gene for which insufficient data exist to assess Gcn4 dependence (32). Columns b and c are based on the present studies using S. pombe.In column b, gray indicates the genes whose expression in wild-type S. pombe cells is induced after 3AT treatment (genes whose expression in S. pombe wild type is induced more than 1.5-fold at 1 and/or 3 h after 3AT treatment). In column c, gray indicates the genes whose induction is dependent on Gcn2 (genes that are induced in wild type and whose average mRNA level at 1 and 3 h is higher in wild type than in gcn2Δ>1.4-fold).

