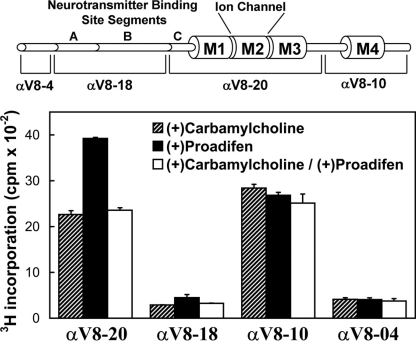
FIGURE 4.
Distribution of [3H]TDBzl-etomidate photoincorporation within large fragments of the nAChR α subunit. nAChR-rich membranes (0.4 mg of protein at 2 mg/ml) were photolabeled with 1.3 μm [3H]TDBzl-etomidate in the presence of 1 mm Carb, 0.1 mm proadifen, or 1 mm Carb and 0.1 mm proadifen. After photolabeling, the samples were subjected to SDS-PAGE, and the polypeptide bands were visualized by Coomassie Blue stain. For each condition, the band corresponding to the nAChR α subunit was excised, transferred to the well of a 15% mapping gel, and digested in gel by S. aureus V8 protease as described under “Experimental Procedures.” Following electrophoresis, the mapping gels were stained with Coomassie Blue to visualize the distinct α subunit polypeptide fragments generated by V8 protease digest (Ref. 31; shown diagrammatically in the upper panel). Each gel was then cut into 5-mm strips, and the 3H incorporation was quantified by scintillation counting. The peaks of 3H were associated with the αV8-20 and αV8-10 fragments, which contain the M1, M2, and M3 segments (αV8-20) or M4 (αV8-10). The data shown are the average and range (vertical bars) of two experiments.

