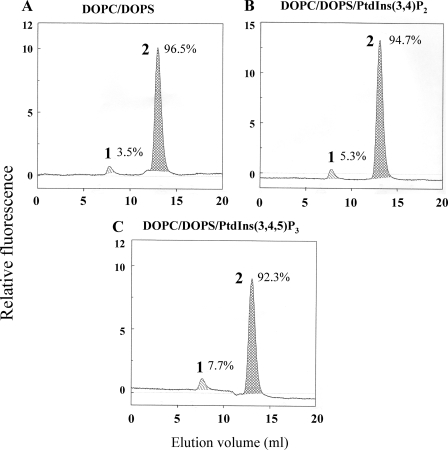
FIGURE 1.
DOPC/DOPS liposomes enriched in PtdIns(3,4,5)P3 or PtdIns(3,4)P2 cause only minimal dissociation of Rac1(mant-GDP)·RhoGDI complexes. 1 nmol of Rac1(mant-GDP)·RhoGDI complex was mixed with liposomes (90 nmol of total phospholipids) comprising 0.74 mm (82.22 mol %) DOPC and 0.16 mm (17.77 mol %) DOPS (A); 0.74 mm (81.30 mol %) DOPC, 0.16 mm (17.58 mol %) DOPS, and 10 μm (1.10 mol %) PtdIns (3,4)P2 (B); or 0.74 mm (81.30 mol %) DOPC, 0.16 mm (17.58 mol %) DOPS, and 10 μm (1.10 mol %) (PtdIns(3,4,5)P3 (C). In all experiments the Rac1(mant-GDP)·RhoGDI complex was preincubated with phospholipid liposomes for 12 min at room temperature. The mixtures were subjected to gel filtration on a Superose 12 FPLC column, and the eluates were monitored in line for the fluorescent signal of Rac1(mant-GDP). In each panel, peak 1 represents Rac1(mant-GDP) dissociated from the Rac1(mant-GDP)·RhoGDI complex and bound to the liposomes eluting in the exclusion volume, and peak 2 represents the non-dissociated Rac1(mant-GDP)·RhoGDI complex. The numbers next to peaks 1 and 2 express the amount of Rac1(mant-GDP) dissociated from the complex and left in the complex, respectively, expressed as a percentage of the total amount of Rac1(mant-GDP) present in the complex injected into the column. Calculations were based on the integration of the relevant peaks. The panels illustrate representative individual experiments of at least two to three experiments performed for each combination of components.

