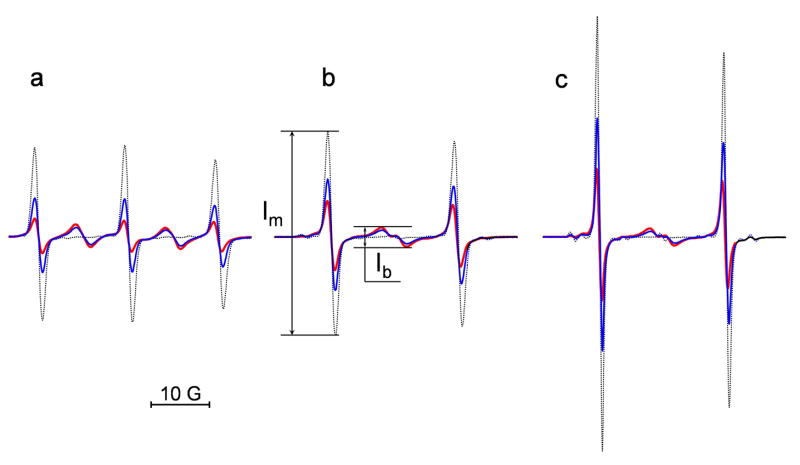
Fig. 1.
The EPR spectra of the DNB label (a) and its isotopically substituted analogues, (b) and (c). The spectra were obtained for 0.1 mM solution of the biradicals alone (red) and after the reaction with different concentrations of GSH added at pH 11.5 (0.1 mM, blue, and 1 mM, black). The spectrometer settings were as following: modulation amplitude, 0.5 G; sweep width, 50 G; microwave power, 10 mW. The maximal increase of the intensity of the “monoradical” component after complete splitting of the disulfide bond, , was equal to (a) 4.6, (b) 3.0 and (c) 3.3. Note that double integration of the EPR spectra shows conservation of the integral spectral intensity during the observed spectral changes.

