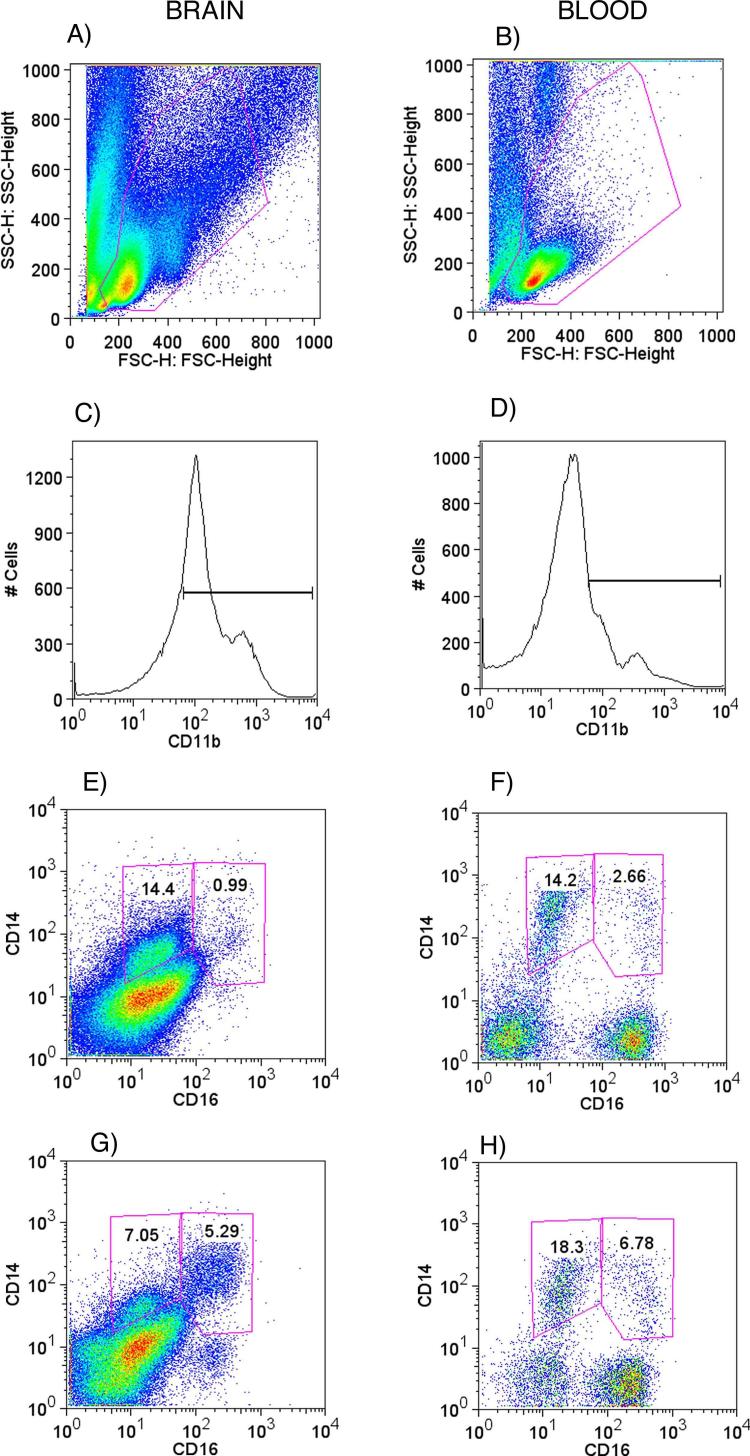
Figure 1.
Brain and blood CD11b-gated CD14/CD16 expressing cells. On the left side panels (A, C, E, and G) are brain cell suspensions, and on the right side panels (B, D, F, and H) correspond to blood samples. A and B show the gate on total leukocytes, excluding granulocytes. C and D show CD11b+ cell gates. E and F are brain and blood cells respectively, from an animal without encephalitis, segregated according to CD14 and CD16 expression, delimiting our target sub-populations. G and H are brain and blood from an animal with encephalitis.

