
Figure 4. Expression patterns of β-oxidation genes.
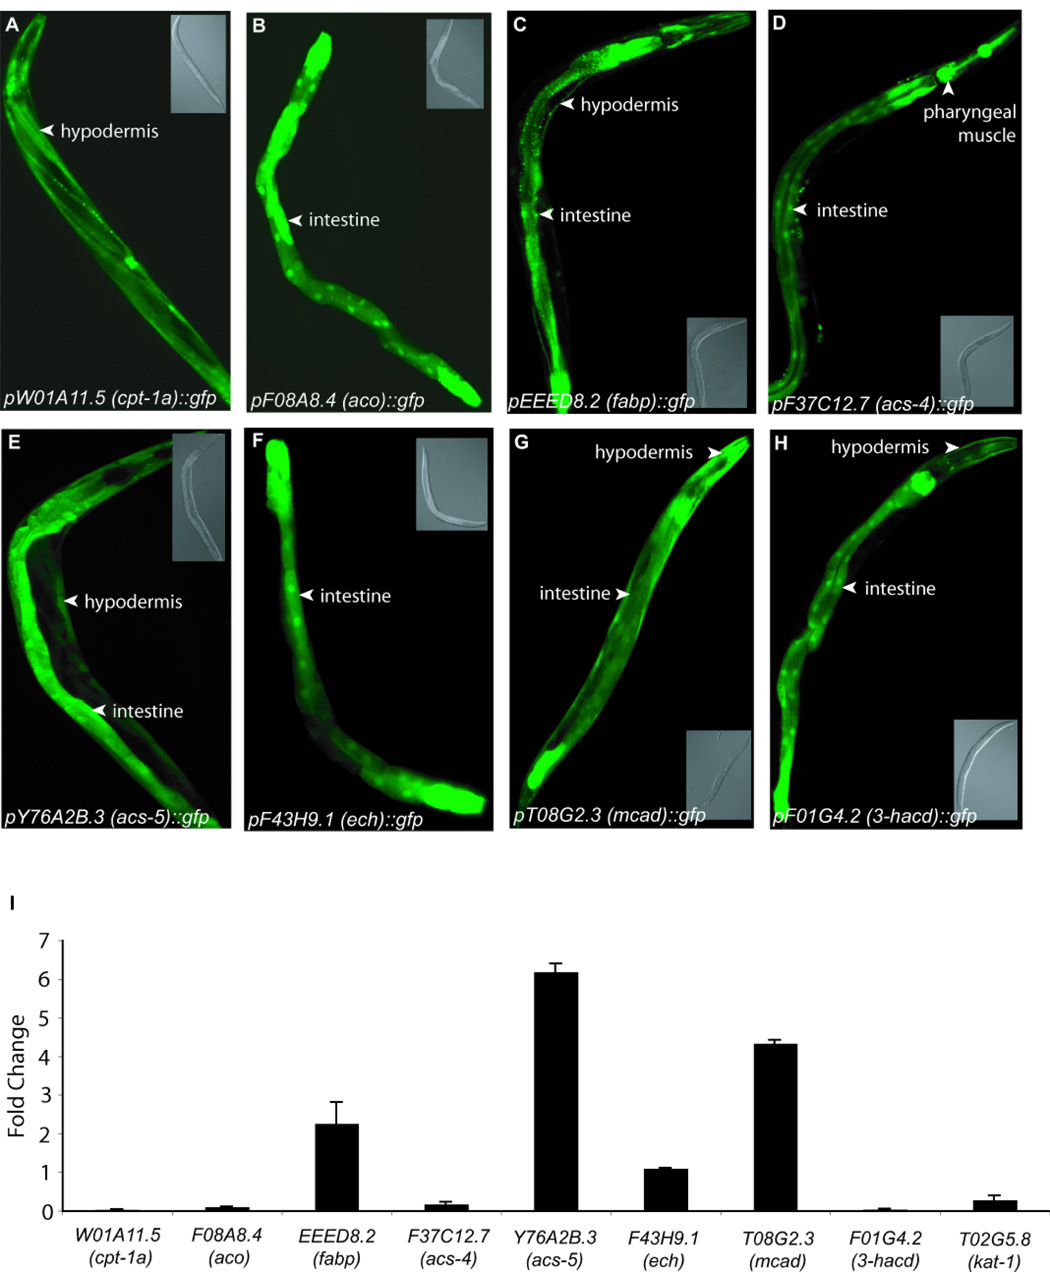
(A–H) Representative images of transgenic animals expressing GFP-reporter fusions for promoters of indicated genes. Inset panels show corresponding DIC images. (I) Change in transcript levels of indicated metabolic genes upon 5HT treatment in wild-type animals as determined by qRT-PCR. The data are reported as the average of two independent cDNA preparations ± s.e.m.