Fig. 1.
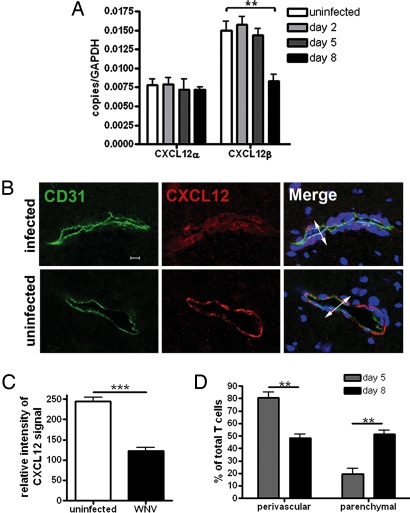
CXCL12 expression in the CNS during WNV encephalitis. (A) QRT-PCR analysis of CXCL12 expression in the CNS of uninfected (white bars) or WNV infected mice (Day 2, light gray bars; Day 5, dark gray bars; and Day 8, black bars). Each group represents at least five individual animals. *, P < 0.05; **; P < 0.005. (B) Confocal immunohistochemical analysis of brain tissue collected from WNV-infected (day 8) (Upper) and uninfected (Lower) mice. Images were stained for CD31 (green), CXCL12 (red), and nuclei (blue). Representative images are shown for five sections, from three mice, in two separate experiments. IC, isotype control. (Scale bar, 10 μm) (C) Relative intensity analysis of CXCL12-stained endothelium in brains of uninfected and WNV-infected (day 8) mice. Data are presented as the average intensity across each vessel for 3–6 mice per group in two separate experiments ±SEM. *, P < 0.001. (D) Quantitative analyses of perivascular versus parenchymal T cells within brains of WNV-infected mice at days 5 (gray bars) and 8 (black bars) after infection. Data are presented as average percentages of T cells as determined by analyzing the associations of CD3+ cells with respect to CD31-stained vessels and counting the numbers of perivascular versus parenchymal cells in 11–19 low power confocal images for 4–5 mice per group ±SEM. *, P < 0.001.

