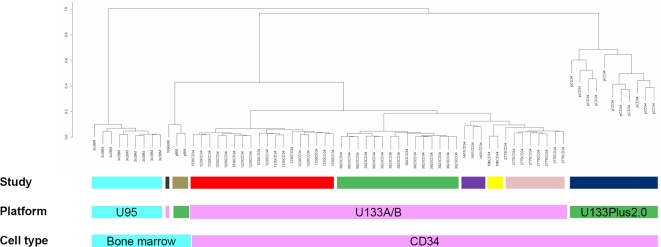
Figure 2. Normal bone marrow HSC clustering.
Experimental conditions, microarray platforms and sources of cells influence gene expression patterns of normal bone marrow derived HSCs. Dendrogram of normal bone marrow derived hematopoietic cells based on unsupervised hierarchical clustering, using (1 - Pearson correlation coefficient) as the distance measure. Same color in each horizontal row indicates same group.

