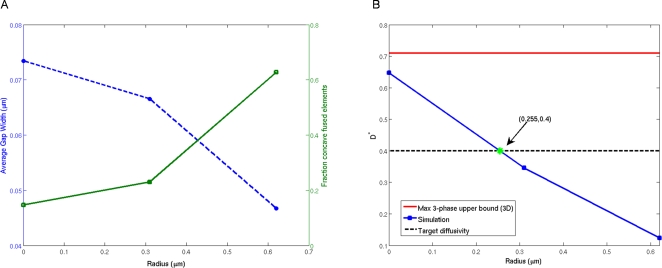
Figure 3. Properties of Three-Phase Model.
(A) The left y-axis (dashed blue line with circles) gives the average gap width in the model and the right y-axis (solid green line with squares) gives the fraction of concave cells in the model. Both plots are given as a function of particle radius (in µm). B) Effective diffusivity of 3D three-phase media at ECS volume fraction ϕ 1 = 0.2 as a function of the particle radius. The results of the simulation are compared to the maximum two-point three-phase upper bound (Equation 3 with a = 1; solid red line) and the target diffusivity (dotted black line).

