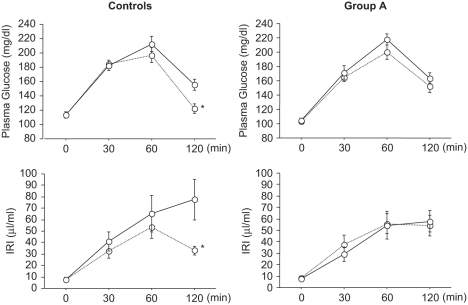
Figure 1.
Time changes in plasma glucose and IRI after glucose loading before and after three months for the controls and group A. Solid line = baseline values; dotted line = post-administration values. Differences between two paired variables were analyzed using the Wilcoxon single-rank test. *p < 0.05.

