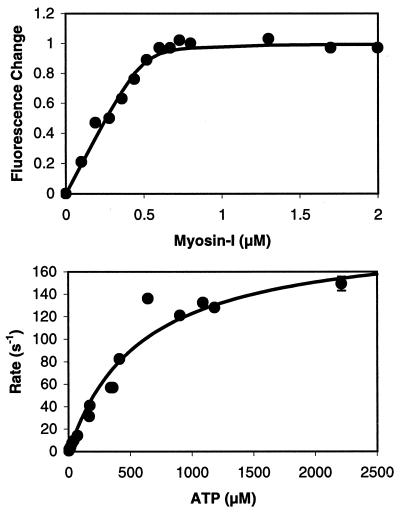
Figure 2.
(Upper) Fluorescence titration of 0.5 μM pyrene-actin-phalloidin with BBM-I. Maximum quenching of fluorescence by BBM-I is plotted as 1.0. The solid line is a fit as described in the text: 1/K7 < 0.01 μM. (Lower) Rate of ATP-induced dissociation of BBM-I from pyrene-actin-phalloidin as a function of nucleotide concentration. Each data point is the average of 1–5 transients from three protein preparations. The solid line is a fit to Eq. 5 as described in the text: K′1 = 1.6 × 10³ ± 300 M−1 and k′2 = 200 ± 19 s−1.

