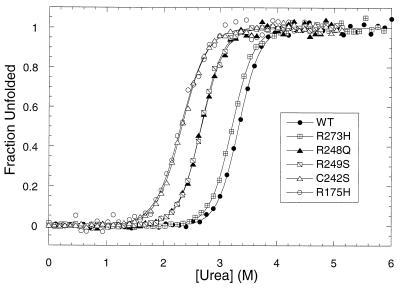
Figure 4.
Urea denaturation of wild-type (WT) and mutant p53 core domain monitored by normalized fluorescence emission at 356 nm (data without normalization are shown for R175H; excellent data are obtained in general without normalization). Data are plotted as fraction unfolded and fitted to Eq. 1. Protein was buffered in 50 mM sodium phosphate, pH 7.2/5 mM DTT. An excitation wavelength of 280 nm was used.

