Figure 2.
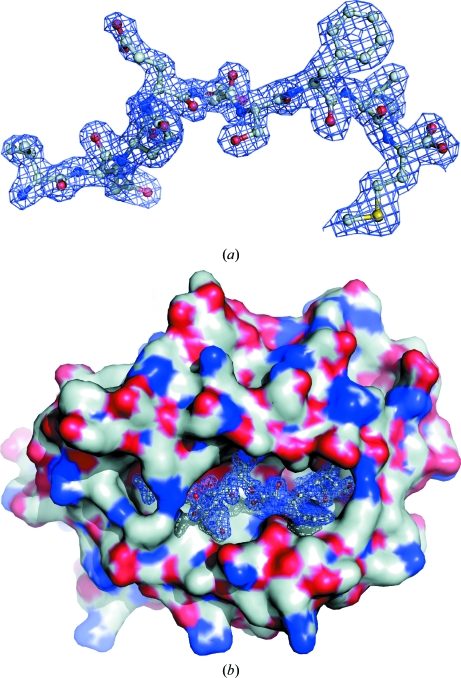
(a) The bound peptide ligand. The 2F o − F c electron-density map (at 1σ) is shown 1 Å around the peptide. The peptide is seen from the side of the α2 helix, which positions its N-terminal end to the left. (b) Surface representation of the peptide-binding groove. The docked peptide is caged by an electron-density mesh as in (a).

