
Fig. 3.
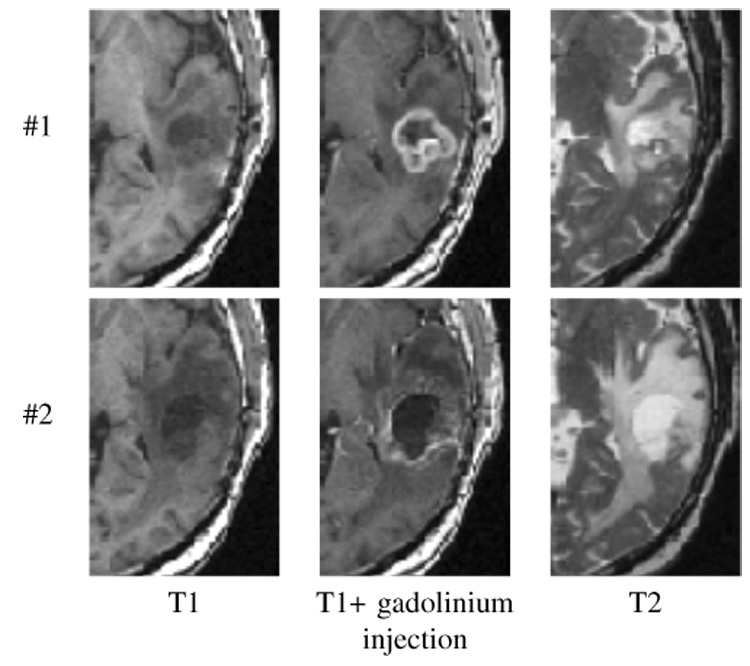
Close up view of the tumor region on the first (#1), and second (#2) MRI series (T1 − T1 + gadolinium injection − T2), acquired respectively in March and September 2001.
Official websites use .gov
A
.gov website belongs to an official
government organization in the United States.
Secure .gov websites use HTTPS
A lock (
) or https:// means you've safely
connected to the .gov website. Share sensitive
information only on official, secure websites.
Close up view of the tumor region on the first (#1), and second (#2) MRI series (T1 − T1 + gadolinium injection − T2), acquired respectively in March and September 2001.