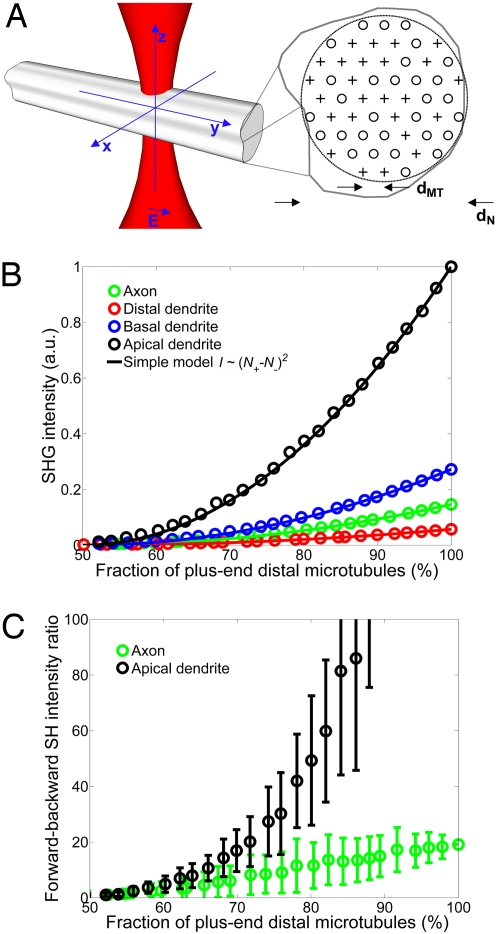
Fig. 4.
Numerical simulation of SHG generated by a microtubule array.(A) Schematic drawing of the simulation model. A focused laser beam impinges on a neurite with diameter dN that contains a hexagonal packed array of plus- or minus-end distal microtubules with intermicrotubule spacing dMT. SHG intensities were calculated in the forward and backward directions for four classes of neurites: apical dendrites (dMT = 64 nm, dN = 3 μm), basal dendrites (dMT = 64 nm, dN = 1 μm), distal dendrites (dMT = 64 nm, dN = 0.5 μm), and axons (dMT = 22 nm, dN = 0.17 μm). (B) Simulated forward-directed SHG intensities generated by each type of neurite (circles). Polarity is defined as the number of plus-end distal microtubules divided by the total number of microtubules in the simulated neurite. The simulated intensities were compared with a simple model (solid line) where SHG intensity ∼[N+ − N−]2, where N+ and N− are the numbers of plus- and minus-end distal microtubules. Backward-directed signals are too small to be shown in the same vertical scale. (C) Simulated fb SHG intensity ratio. The error bars are ±SD. Uncertainty is caused by the possible variety of microtubule distributions that can be arranged within a neurite.

