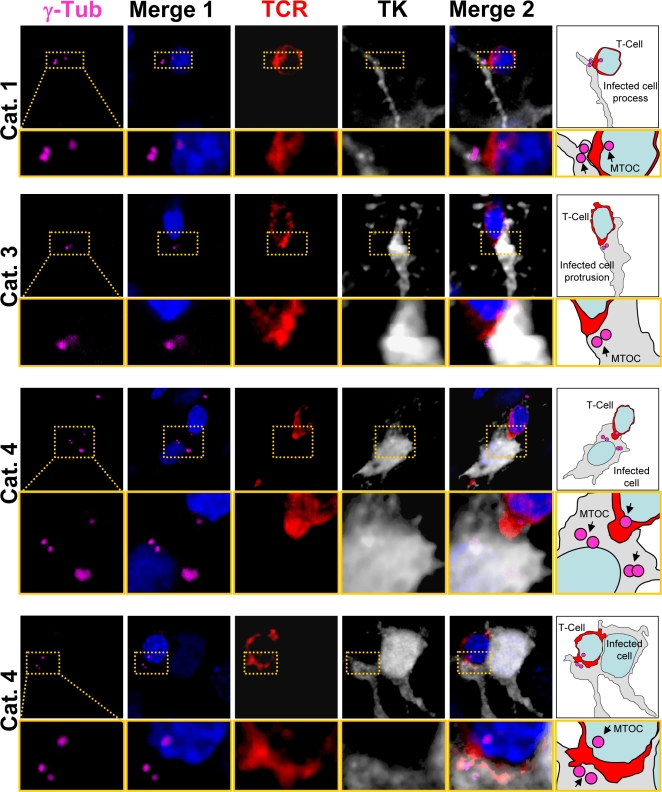
Figure 4. The MTOC of infected brain cells is polarized to the T cell.
Representative confocal images of four contacts between astrocytes and T cells. Cells were labeled with markers for MTOC (γ-Tubulin, magenta), viral infection (TK, white), and T cells (TCR, red); and nuclei are stained with DAPI (blue), using immunofluorescent techniques. MERGE 1 is a composite image showing nuclear staining and MTOC. MERGE 2 shows MTOC, virally infected cells, T cells, and nuclei. A magnification of the contact zone is shown below each panel. The right hand column contains drawings of the MERGE 2 images, indicating the spatial relationship between the MTOC (magenta) of the virally infected cells (grey), and the T cells (red). The first row shows a cell of Category 1. The MTOC is localized in a process of the infected cell. The MTOC of the T cell is facing the MTOC of the infected cell. TCR also is polarized towards the infected process. The second row of images represents a cell of Category 3, with MTOC and TCR polarized towards the T cell. The third row shows a cell of Category 4, also with MTOC polarized to the T cell but positioned to one side of the T-astrocyte interface; notice that this astrocyte appears to have multiple MTOC-like structures. Also the MTOC of the T cell is polarized to the MTOC of the infected cell. The bottom row shows another Category 4 cell immunological synaptic junction.

