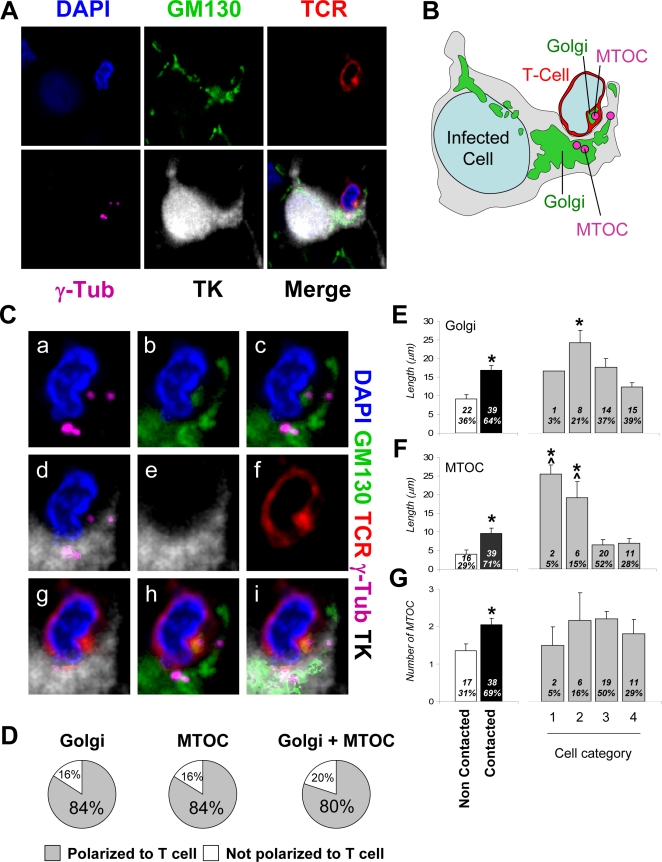
Figure 5. Intracellular distributions of the Golgi apparatus and MTOC are altered in infected brain cells contacted by T cells.
A. Confocal images of an infected cell contacted by a T cell, immunofluorescently labeled with markers for MTOC (γ-Tubulin, magenta), Golgi apparatus (GM130, green), viral infection (TK, white), T cells (TCR, red), and with nuclei stained with DAPI (blue). The Golgi apparatus and the MTOC of the virally infected cell are polarized towards the T cell, and the Golgi apparatus and MTOC from the T cell are polarized towards the virally infected cell. TCR displays a pattern typical of the c-SMAC, characteristic of Kupfer-type immunological synapses, and is polarized towards the infected cell. B is a drawing of the cell shown in A. C. Higher magnification images of the T cell contact zone shown in A. MTOC and Golgi apparatus of both cells are facing each other (a, c, d and g–i). The MTOC and the Golgi apparatus are localized in the same area. TCR fluorescence co-localizes with Golgi apparatus and MTOC in the T cell (a–i). D shows the percentage of virally infected brain cells with Golgi and/or MTOC polarized towards the T cell. More than 80% of infected astrocytes forming immunological synapses show evidence of Golgi and/or MTOC polarization. (E) shows results of quantification of length of Golgi apparatus; the left histogram shows that it is significantly longer in contacted than in non-contacted cells (*p<0.05, Student's t test). Among contacted cells, it is significantly longer in Category 2 cells compared to the other categories (*p<0.05, One-way ANOVA). (F) shows the distance of the MTOC from the nucleus of the infected cells, and reveals that this distance is larger in the contacted than in non-contacted cells (*p<0.05, Student's t test), and among contacted cells is larger in categories 1 and 2 than in 3 and 4 (ˆ* p<0.05 vs. Category 3, non-parametric Kruskal-Wallis test followed by Dunn's post-test; ˆ* p<0.05 vs. Category 4, non-parametric Kruskal-Wallis test followed by Dunn's post-test). (G) shows the number of MTOC found in the infected cells and suggests that this is greater in contacted than in non-contacted cells (*p<0.05, Student's t test).

